In the discussion of molecular excitation, a single graph is used consistently because of its ability to summarize key information. This graphical representation is referred to as a Jablonski diagram.
The Jablonski diagram is capable of showing the transition between ground states and excited states by using quantized Morse potentials. As we will see later, it is also capable of showing other events, like fluorescence, which is an example of molecular emission which follows an excitation event.
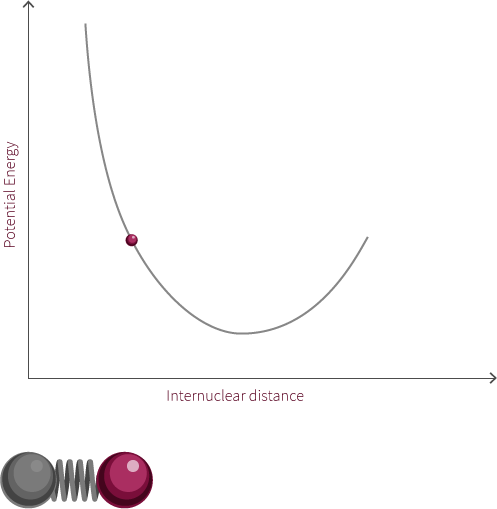
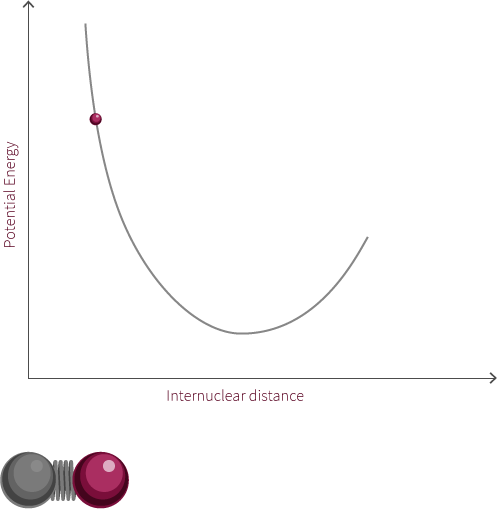
A simple Jablonksi diagram is shown to the right involving a transition from a ground state to an excited state. Excitation events happen on extremely fast time scales, so excitation from a ground state to an excited state appears instantaneously on our diagram. When comparing time scales, we find that bond oscillation (10-12 to 10-14 s) is much slower than absorption and excitation (~10-15 s).
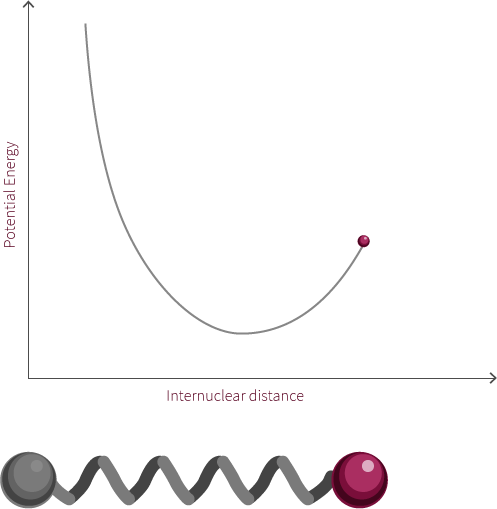
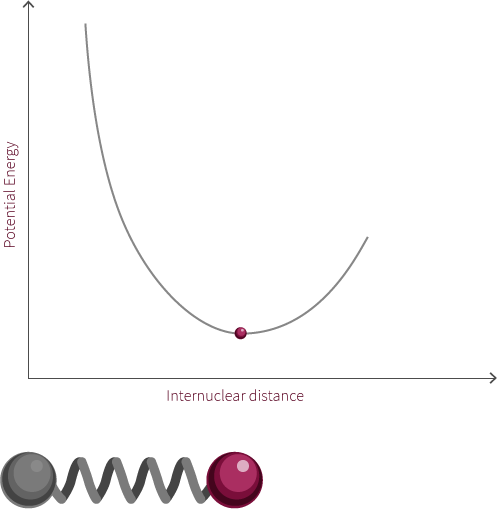
In the interactive module to the left you decide when to promote an electron. Based on the inter-nuclear distance and vibrational state the electron will get promoted to a certain excited vibrational state in accordance to the Franck-Condon principle. A diagram outlining the Franck-Condon principle is shown below.
Franck-Condon
Over time, the molecule will lose energy through vibrational relaxation where energy is lost to its surroundings (ie. transfer of energy through molecular collisions). Internal conversion is a process whereby the electron switches from a 'low vibrational excited state', to a 'high vibrational ground state'.
Try promoting the electron from different internuclear distances (click the pi orbital or the promote electron button). What happens to the excitation photon? Hover over the labels to highlight the transitions, why do they jump from state to state?