WINTER
Legend

SPRING
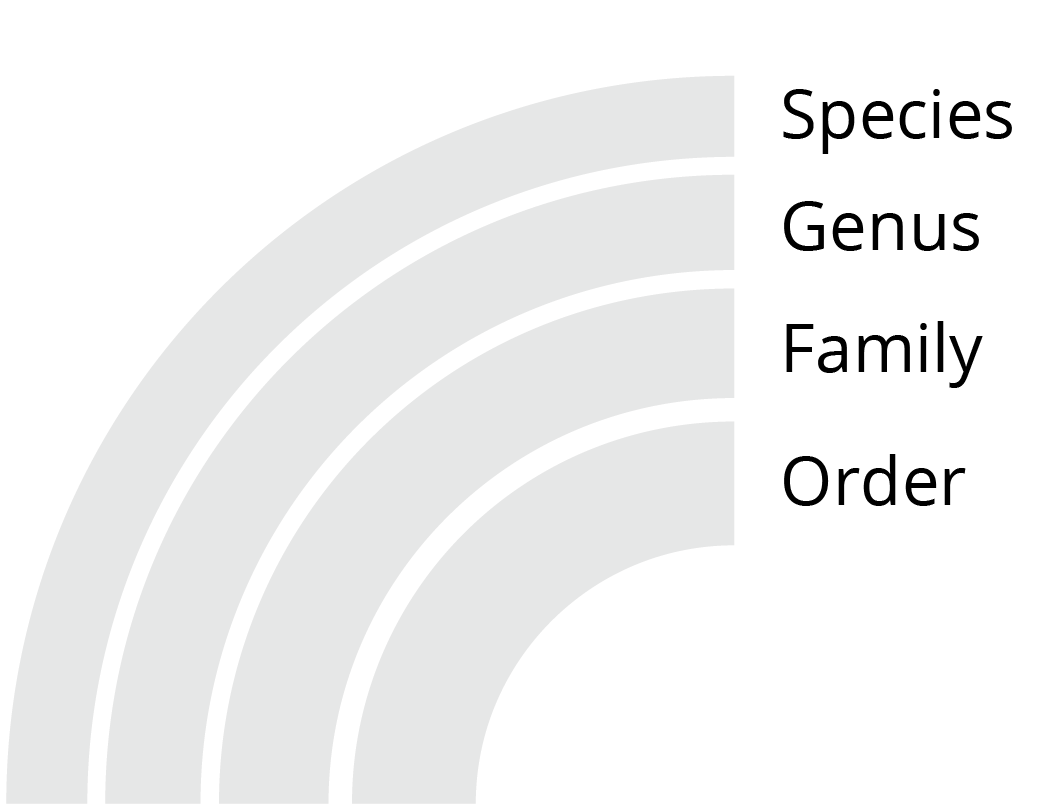
This interactive data visualization shows the different types of birds that were observed in the winter and spring of 2016 in Canada, organized by taxonomic classification (eBird Observation Datasets obtained from Global Biodiversity Information Facility, published by Cornell Lab of Ornithology). The sunburst diagram on the left shows the species composition of the 312,866 birds that were reported to be seen in Feb 2016; the sunburst diagram on the right shows the species composition of the 1,419,107 birds that were reported to be seen in May 2016.
Use the mouse cursor to hover over a segment of the sunburst diagram to highlight and display the name of the bird order/family/genus/species as well as the corresponding percentages for both months. Move the mouse cursor off the sunburst diagram to unhighlight the bird order/family/genus/species.
Legend

WINTER
SPRING
Data visualization by Maurita Hung
References
1. GBIF.org (25th March 2019) GBIF Occurrence Download https://doi.org/10.15468/dl.clugg8
2. GBIF.org (1st March 2019) GBIF Occurrence Download https://doi.org/10.15468/dl.fbhsaw
3. D3 sunburst visualization code obtained from https://bl.ocks.org/kerryrodden/7090426" target = "_blank
4. Colour schemes were obtained from ColorBrewer scales at https://observablehq.com/@d3/color-schemes
Note: Segments that were not large enough to be seen were excluded from the data visualization.